examples.heterogeneous
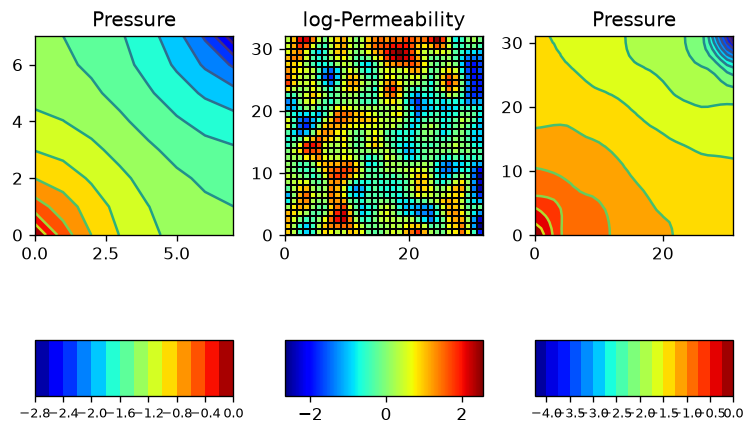
Reproduce Fig. 1 of the reference paper, i.e. example 1.
Solves the (single, elliptic) pressure equation on a uniform permeability field (coarse grid) and on a random, smoothed, log-normal one (finer grid).
There are some discrepancies, of course, because of
- The use of random numbers
- Differences in scipy's
smoothand matlab - It appears they've translated the pressure field to be positive
(in their panels it seems to have minimum value 0).
As a velocity potential, this should not matter.
Indeed, since
ct == 0here, the pressure is only defined up to a constant; refexamples.pressure_diffusion.
In the figure:
- Left panel: with uniform permeability, the isobars are smooth arcs, centred on the wells in the SW and NE corners.
- Right panel: the same solve, but on the (smoothed, log-normal) permeability of the middle panel. The isobars are now distorted, bunching up over the low-permeability regions -- the correlation of $\log |∇p|$ with $\log K$ is about $-0.4$ -- since the tighter the rock, the steeper the gradient needed to pass a given flux.
 1"""Reproduce Fig. 1 of the reference paper, i.e. example 1.
 2
 3Solves the (single, elliptic) pressure equation on a uniform permeability field
 4(coarse grid) and on a random, smoothed, log-normal one (finer grid).
 5
 6There are some discrepancies, of course, because of
 7
 8- The use of random numbers
 9- Differences in scipy's `smooth` and matlab
10- It appears they've translated the pressure field to be positive
11  (in their panels it seems to have minimum value 0).
12  As a *velocity* potential, this should not matter.
13  Indeed, since `ct == 0` here, the pressure is only defined up to a constant;
14  ref `examples.pressure_diffusion`.
15
16In the figure:
17
18- Left panel: with uniform permeability, the isobars are smooth arcs,
19  centred on the wells in the SW and NE corners.
20- Right panel: the same solve, but on the (smoothed, log-normal) permeability
21  of the middle panel. The isobars are now distorted, bunching up over the
22  low-permeability regions -- the correlation of $\\log |∇p|$ with $\\log K$ is
23  about $-0.4$ -- since the tighter the rock, the steeper the gradient needed
24  to pass a given flux.
25"""
26
27from mpl_tools.place import freshfig
28import numpy as np
29import numpy.random as rnd
30from scipy.ndimage import uniform_filter as smooth
31
32from TPFA_ResSim import ResSim
33from TPFA_ResSim.plotting import show
34
35rnd.seed(4)  # Reproducibility (the values are regression tested)
36
37fig, axs = freshfig("Fig. 1", ncols=3, nrows=2, gridspec_kw={'height_ratios': (9, 1)})
38
39## Panel 0: uniform permeability, coarse grid
40model = ResSim(Lx=1, Ly=1, Nx=8, Ny=8,
41               wells=[dict(xy=[0, 0], rate=+1), dict(xy=[1, 1], rate=-1)])
42
43model.assemble_wells(None, None, 0)
44[P_coarse, V] = model.TPFA(model.K)
45
46ax = axs[0, 0]
47ax.set(title="Pressure", aspect="equal")
48cc = ax.contourf(P_coarse.reshape(model.shape).T, levels=17, cmap="jet")
49ax.contour(P_coarse.reshape(model.shape).T, levels=17)
50cb = fig.colorbar(cc, axs[1, 0], orientation="horizontal")
51cb.ax.tick_params(labelsize=8)
52
53## Panels 1 and 2: heterogeneous permeability, finer grid
54model = ResSim(Lx=1, Ly=1, Nx=32, Ny=32,
55               wells=[dict(xy=[0, 0], rate=+1), dict(xy=[1, 1], rate=-1)])
56logK = 5*smooth(smooth(rnd.randn(2, *model.shape)))
57model.K = np.exp(logK)
58
59ax = axs[0, 1]
60ax.set(title="log-Permeability", aspect="equal")
61# ax.imshow(K.T[::-1, :, 0], cmap="jet")
62cc = ax.pcolormesh(logK.T[..., 0], edgecolors='k', linewidth=.01, cmap="jet")
63fig.colorbar(cc, axs[1, 1], orientation="horizontal")
64
65model.assemble_wells(None, None, 0)
66[P_fine, V] = model.TPFA(model.K)
67
68ax = axs[0, 2]
69ax.set(title="Pressure", aspect="equal")
70cc = ax.contourf(P_fine.reshape(model.shape).T, levels=17, cmap="jet")
71ax.contour(P_fine.reshape(model.shape).T, levels=17)
72cb = fig.colorbar(cc, axs[1, 2], orientation="horizontal")
73cb.ax.tick_params(labelsize=8)
74
75fig.tight_layout()
76
77# Regression values, checked by `tests/test_examples.py`.
78__digest__ = dict(pres_coarse = P_coarse,
79                  pres_fine   = P_fine)
80
81if __name__ == "__main__":
82    show()